Fishbone Analysis / Cause and Effect Analysis
Introduction
Fishbone analysis also known as cause and effect analysis was created by Kaoru Ishikawa. The analysis suggests that in order to solve a problem (or effect) an organisation should try to find out the causes behind the effect. Discovering all of the causes will help an organisation solve the problem and plan how to prevent the problem from reoccurring.
Fishbone Diagram
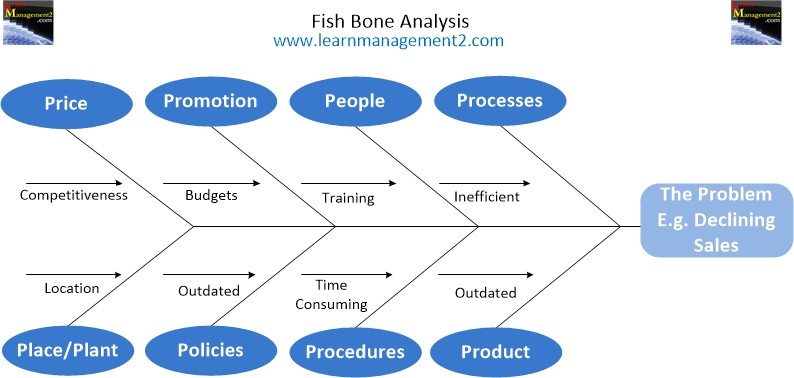
Fishbone analysis involves drawing a diagram (showing the effect and each of its causes) in a fish skeleton shape. A cause and effect analysis is usually completed in teams, where the skeleton is completed through the team, brainstorming possible causes. The problem is written at the head of the fish skeleton and each cause is recorded next to a fishbone. Recording each cause as a bone encourages people to explore all of the causes fully and should stop them jumping to assumptions, which prevent them discovering the true (root) cause of the effect.
Grouping Causes
There could be a large list of possible causes, splitting the causes into groups may help you remember to cover all of them. The groups will depend on the industry that the organisation is based in. For example manufacturing industries could be split as follows:
Machinery
- Materials the firm uses
- Production methods
- Employees (Manpower)
The groups are not "set in stone" each organisation should change them, to suit their organisational activities and the problem they are analysing.
Example Fishbone Analysis
The example fishbone analysis provided below, explores a problem with a firm operating in the service industry. Service industry tasks are usually split into four groups known as the 4Ps: policies, procedures, people, and plant (technology). To fully explore the causes additional groups from the marketing mix (product, price, promotion,place) have been added.
